You are still pregnant, what is the probability that you will give birth today?
I pondered that question when Sarah was 38 weeks pregnant with Liam. In the end, he was born at 40w +2 days.
We all know that the expected due date is at 40 weeks. I found a data sample online, and build the graph showing the probability to give birth on any day, knowing of course that you have not given birth yet, which means that the statistics from the birth withe earlier date are not relevant any more.
Here is the data set, a study of 9446 pregnancies…
data = {{245, 17}, {246, 19}, {247, 13}, {248, 23}, {249, 22}, {250,
22}, {251, 21}, {252, 36}, {253, 26}, {254, 37}, {255, 40}, {256,
32}, {257, 39}, {258, 46}, {259, 72}, {260, 66}, {261, 68}, {262,
82}, {263, 100}, {264, 87}, {265, 128}, {266, 145}, {267,
128}, {268, 142}, {269, 187}, {270, 232}, {271, 200}, {272,
247}, {273, 302}, {274, 269}, {275, 282}, {276, 362}, {277,
387}, {278, 381}, {279, 438}, {280, 553}, {281, 495}, {282,
421}, {283, 400}, {284, 374}, {285, 381}, {286, 391}, {287,
381}, {288, 295}, {289, 232}, {290, 227}, {291, 162}, {292,
123}, {293, 106}, {294, 77}, {295, 31}, {296, 29}, {297,
25}, {298, 13}, {299, 11}, {300, 10}, {301, 11}};
Let’s confirm why the due date is at 280 days:
ListPlot[data, Joined -> True,
Epilog -> {Red, Line[{{280, 0}, {280, Max[Last /@ data] + 10}}]}]
What is the probability to give birth, before, at, or after the due date?
Total[ Last /@ Select[data, #[[1]] < 280 &] ]/ Total[Last /@ data] // N 0.49
Total[ Last /@ Select[data, #[[1]] > 280 &] ] / Total[Last /@ data] // N 0.44
Last /@ Select[data, #[[1]] == 280 &] / Total[Last /@ data] // N 0.058
Almost 6% of births are on the due date, 49.7% before the due date, and 44.4% after the due date.
So, if you have not given birth yet, this tells you what the probability you will give birth today:
startDate = data[[1, 1]];
futureSet = Select[data, First[#] >= startDate &];
normalizedData = {First[#],
N[100*Last[#]/ Total[Last /@ futureSet], 3]} & /@ futureSet;
nestedDataSet = NestList[Rest, futureSet, Length[futureSet] – 1];
prob = {#[[1, 1]], N[100*#[[1, 2]]/ Total[Last /@ #], 3]} & /@
nestedDataSet;
ListPlot[prob, Joined -> True, PlotRange -> All,
Epilog -> {Red, Line[{{280, 0}, {280, 100}}]},
GridLines -> Automatic]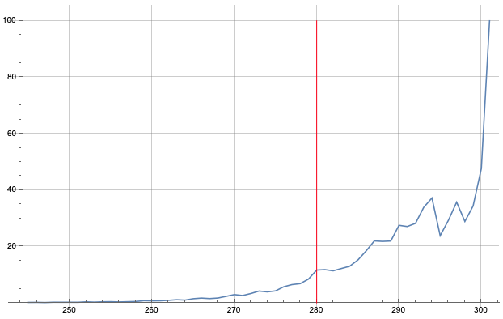
The data is getting noisy at the end, because out of the ~9500 pregnancies, only ~200 went past 294 days.
So, while it is true that early in the pregnancy, you have a 6% chance to deliver on the due date, if you have not delivered by the day before the due date, you now have a 10% chance to deliver the next day!!
Enjoy!!
Luc